
Q2 2026 | National M&A Insights
Q2 2026 National M&A Insights from William & Wall examines 4,058 reported U.S. mergers and acquisitions totaling approximately $673.2 billion in disclosed transaction value, with technology and energy leading deal value and industrials demonstrating substantial acquisition activity. Headquartered in Scottsdale, Arizona, William & Wall provides nationwide investment banking, sell-side M&A advisory, and private equity M&A advisory services to business owners navigating strategic sales, recapitalizations, and ownership transitions.
The information reflects transactions as reported, including deal descriptions, values, and statuses, but may contain gaps, such as undisclosed deal terms or financial metrics, which limit comprehensive analysis. While efforts have been made to ensure accuracy, users should consult primary sources or professional advisors for legal, financial, or strategic decisions. No warranties are made regarding the completeness or reliability of this data, and the provider assumes no liability for its use.
This Quarter - National Transaction Value ($bn) and Transaction Count


National M&A Overview: Q2 2026
The defining characteristic of U.S. mergers and acquisitions in the second quarter of 2026 was the uneven distribution of transaction value across an otherwise active national market. From April 1 through June 30, the market registered 4,058 reported transactions representing approximately $673.2 billion in disclosed consideration. Beneath those headline figures, however, monthly results revealed a notable disconnect between the number of acquisitions and the capital associated with them. May generated $317.7 billion in disclosed value, nearly half the quarterly total, despite recording just 1,271 transactions—the fewest of any month. June, by contrast, led in transaction count with 1,405 deals but contributed a smaller $228.6 billion, while April recorded 1,382 transactions totaling $126.9 billion. The disparity illustrates how aggregate transaction values can fluctuate substantially even when underlying deal frequency remains relatively consistent.
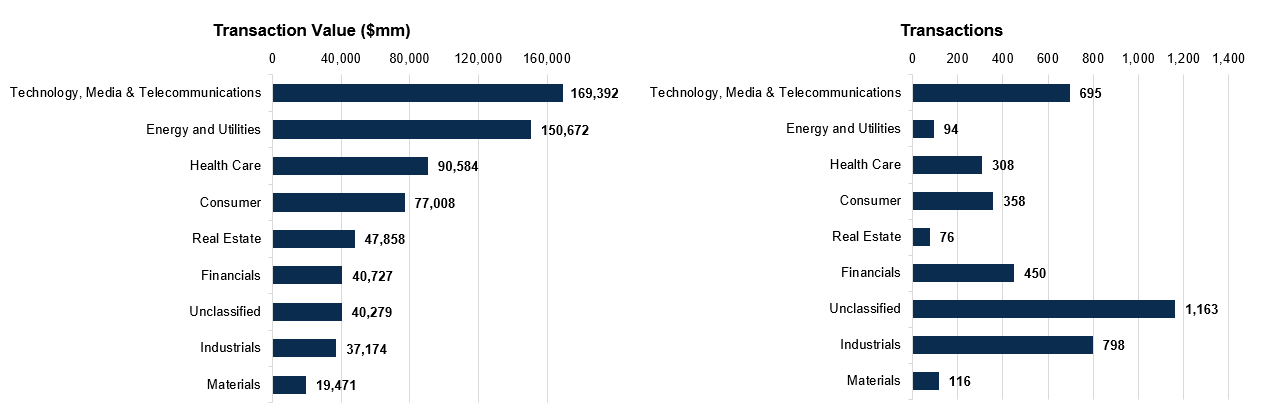
Much of this variation can be traced to the timing and sector composition of reported transactions. Energy and Utilities contributed approximately $132.0 billion in May alone, accounting for nearly 88% of the sector's $150.7 billion quarterly total. Technology, Media & Telecommunications (TMT) exhibited a different pattern, with approximately $107.0 billion of its $169.4 billion in disclosed consideration concentrated in June. Together, these sectors represented nearly 48% of all reported transaction value during Q2, although their combined 789 transactions accounted for less than one-fifth of national deal volume. Such differences are important when interpreting national M&A statistics: the industries producing the greatest dollar volume are not necessarily those experiencing the broadest transaction activity.
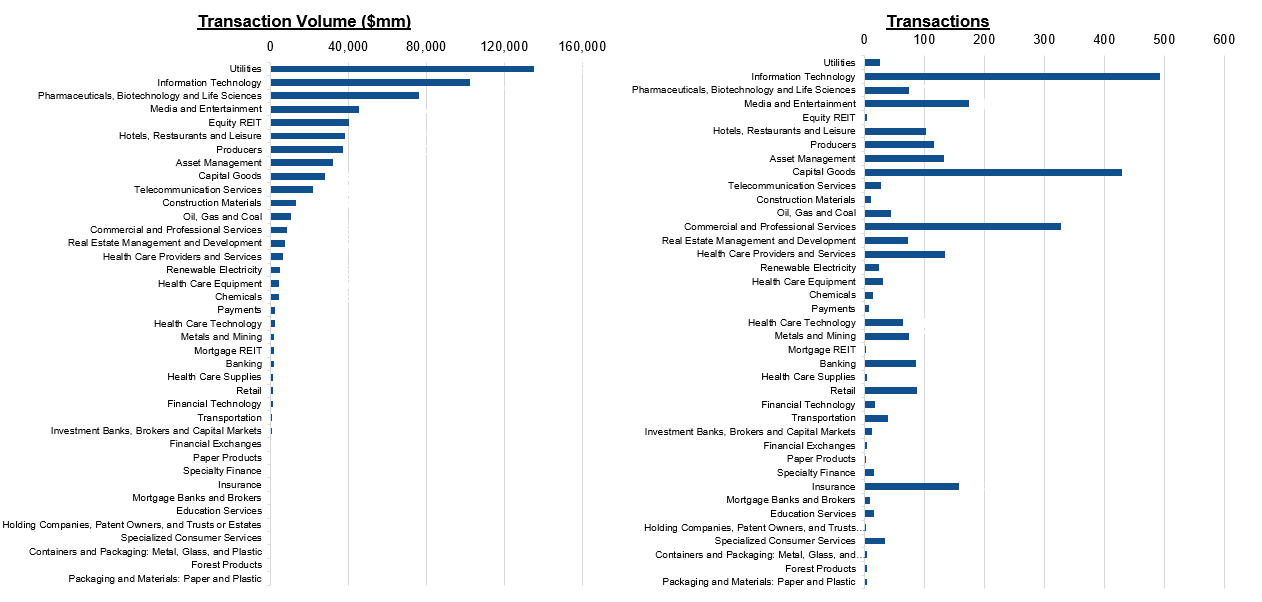
Outside these concentrations, acquisition activity spanned a considerably wider collection of industries. Healthcare generated $90.6 billion across 308 transactions, with pharmaceuticals, biotechnology, life sciences, and healthcare services represented in the detailed industry data. Consumer companies recorded $77.0 billion across 358 transactions, while Real Estate contributed $47.9 billion from only 76 reported deals. Collectively, these sectors accounted for roughly one-third of the quarter's disclosed value, highlighting the significance of both operating-company acquisitions and transactions involving substantial underlying assets. Their contributions were not evenly distributed throughout the quarter: Healthcare recorded its largest monthly value in April, while Consumer and Real Estate reached their quarterly peaks in May.
A different picture emerges when the market is examined through transaction frequency rather than aggregate consideration. Industrials registered 798 transactions, the highest total among explicitly classified sectors, yet represented $37.2 billion in disclosed value. Within the more detailed industry groupings, Capital Goods and Commercial and Professional Services were prominent sources of acquisition activity. Financials recorded another 450 transactions totaling $40.7 billion, encompassing banking, insurance, asset management, and related financial businesses. Materials contributed 116 deals representing $19.5 billion. Notably, 1,163 transactions—approximately 29% of the national total—were classified as Unclassified, accounting for $40.3 billion in consideration. This sizable category limits the extent to which reported sector rankings can be interpreted as a complete picture of industry-level acquisition demand.
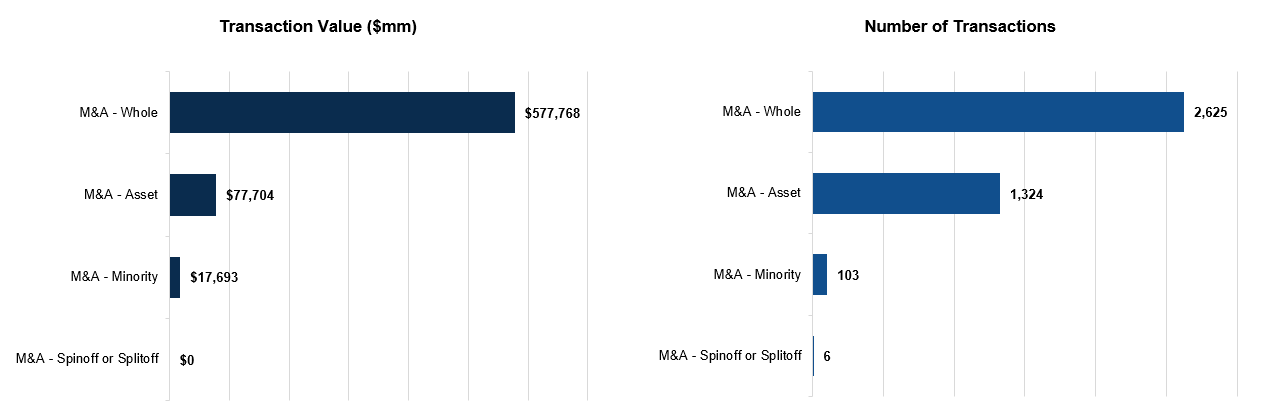
Transaction structure provides an additional perspective on the quarter. Whole-company acquisitions represented approximately 65% of all reported transactions but accounted for nearly 86% of disclosed transaction value, equivalent to $577.8 billion across 2,625 deals. Asset acquisitions were much more prevalent by number than by value, with 1,324 transactions generating $77.7 billion in reported consideration. Minority investments contributed $17.7 billion across 103 transactions, while six spinoff or splitoff transactions carried no disclosed value in the dataset. The concentration of consideration in whole-company acquisitions reflects the substantial role of control transactions in the reported market, while the frequency of asset acquisitions illustrates the importance of alternative transaction structures within the broader M&A landscape.
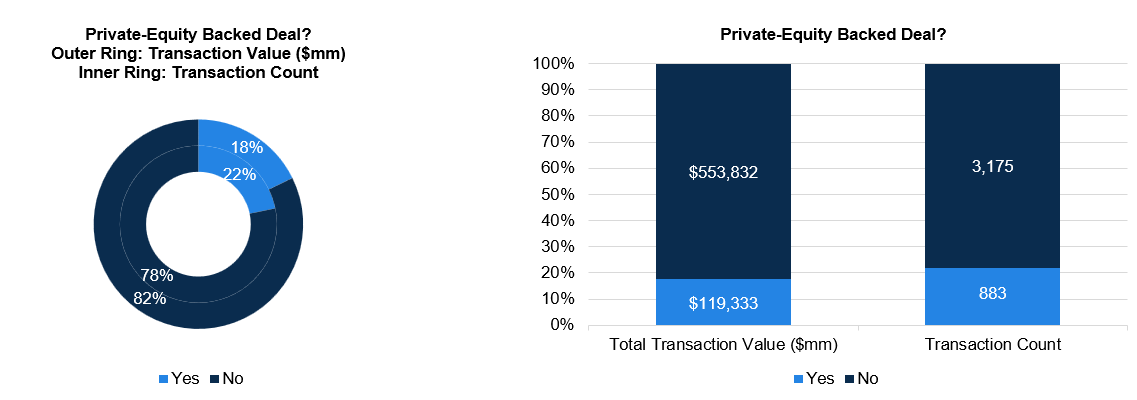
Private equity-backed activity added another dimension to the national picture. During Q2, 883 transactions were identified as PE-backed, representing approximately 22% of the national deal count and $119.3 billion, or roughly 18%, of disclosed consideration. The remaining 3,175 transactions accounted for $553.8 billion in value and were not classified as private equity-backed. The distinction is relevant for business owners contemplating a sale: sponsor-backed transactions form a meaningful component of the acquisition market, but the dataset also encompasses a substantially larger population of transactions outside that classification. Sponsor backing alone does not establish the identity of the ultimate acquirer or the precise nature of the investment, making transaction-level analysis essential when evaluating potential buyers.
Taken together, the second quarter demonstrated why headline M&A figures should be interpreted alongside transaction composition, industry concentration, and buyer structure. A relatively narrow group of sectors accounted for a substantial share of national deal value, while thousands of additional transactions occurred across industrials, financial services, consumer businesses, and other industries. For privately held and middle-market companies, the most useful signals are therefore not necessarily the largest transactions attracting national attention, but the patterns of acquisition activity within their own industries. Business owners considering an exit or recapitalization must evaluate how prospective buyers assess earnings quality, management continuity, growth opportunities, and transaction risk. Q2 2026 provided evidence of a broad and varied acquisition market, while underscoring that successful transaction outcomes remain highly dependent on the characteristics of the individual business.
M&A Segmentation
Sector Breakdown:
Sponsor Activity:
M&A Glossary:
M&A – Whole: The acquisition of 100% ownership of a target company, giving the buyer full control.
M&A – Asset: The purchase of specific assets, such as mineral rights or property, without acquiring the entire company.
M&A – Minority: The acquisition of a non-controlling stake, typically under 50%.
M&A – Spinoff or Splitoff: The divestiture of a business unit into a separate entity or distribution of subsidiary shares to shareholders.
Copyright ©2026 William & Wall, S&P Global Market Intelligence
