
Q1 2026 | National M&A Insights
The information reflects transactions as reported, including deal descriptions, values, and statuses, but may contain gaps, such as undisclosed deal terms or financial metrics, which limit comprehensive analysis. While efforts have been made to ensure accuracy, users should consult primary sources or professional advisors for legal, financial, or strategic decisions. No warranties are made regarding the completeness or reliability of this data, and the provider assumes no liability for its use.
This Quarter - National Transaction Value ($bn) and Transaction Count
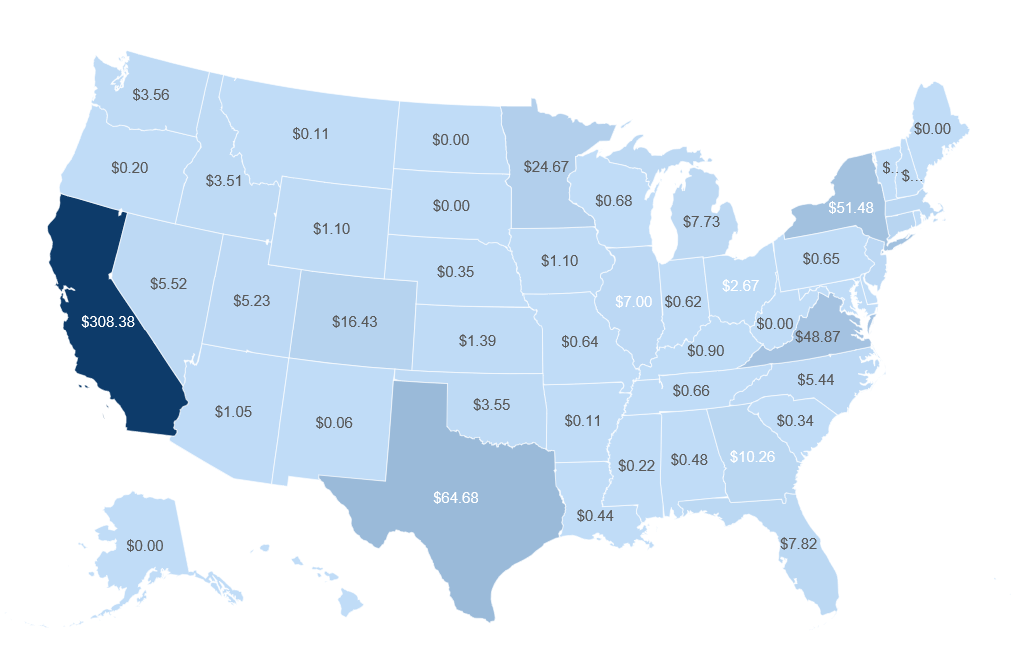
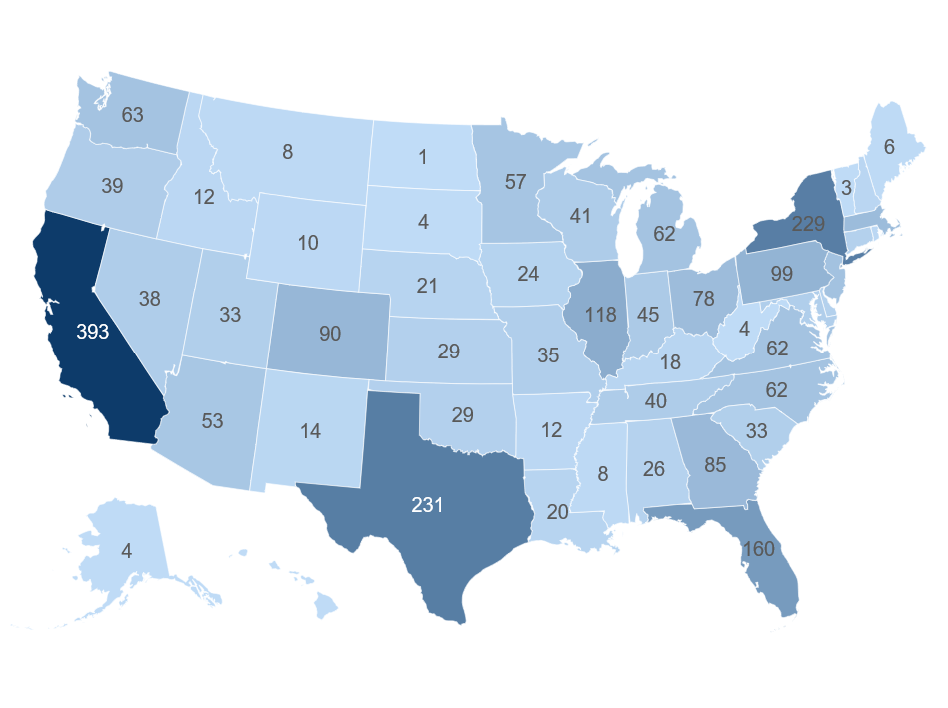
National M&A Overview: Q1 2026
The U.S. M&A market in Q1 2026, spanning January 1 to March 31, recorded approximately 4,529 transactions and $696.8 billion in total disclosed transaction value across major sectors of the economy. Dealmaking activity reflected substantial capital deployment across technology, energy, financial services, and healthcare, while transaction volume demonstrated broader participation across industrials, consumer businesses, and professional services. Whole-company acquisitions represented approximately 89.5% of total disclosed value, underscoring the importance of control-oriented transactions in the national M&A landscape. Private-equity-backed acquisitions also accounted for a significant proportion of aggregate value, highlighting the continued role of financial sponsors alongside strategic acquirers in shaping transaction activity during the first quarter.
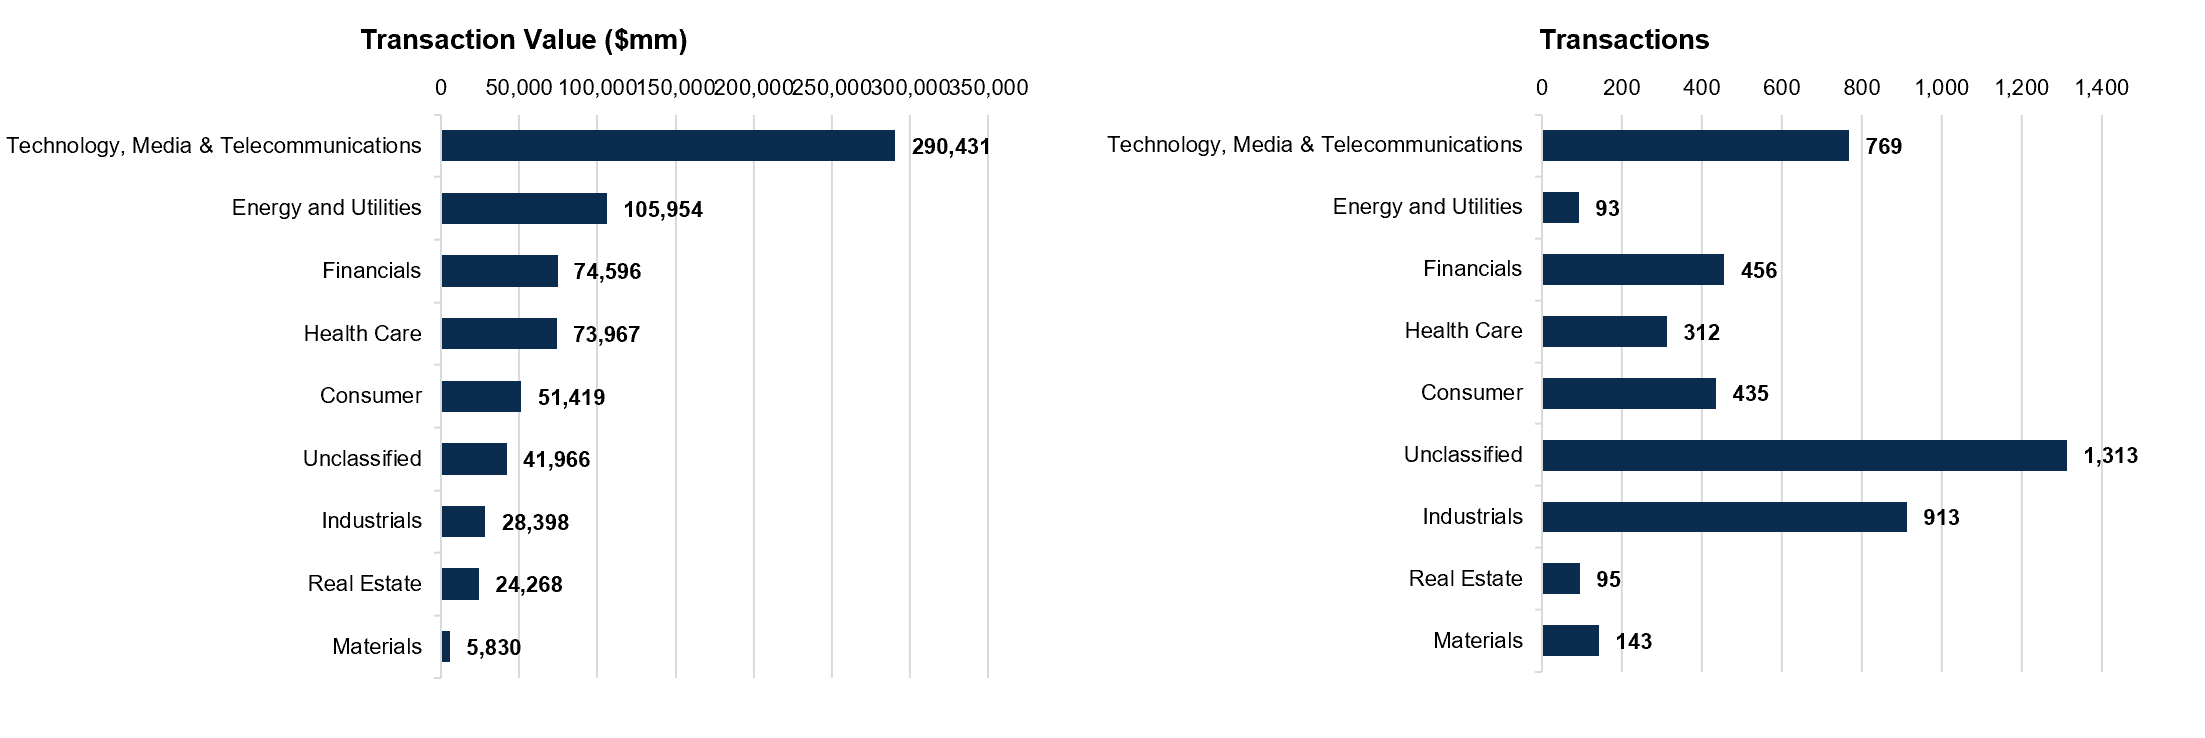
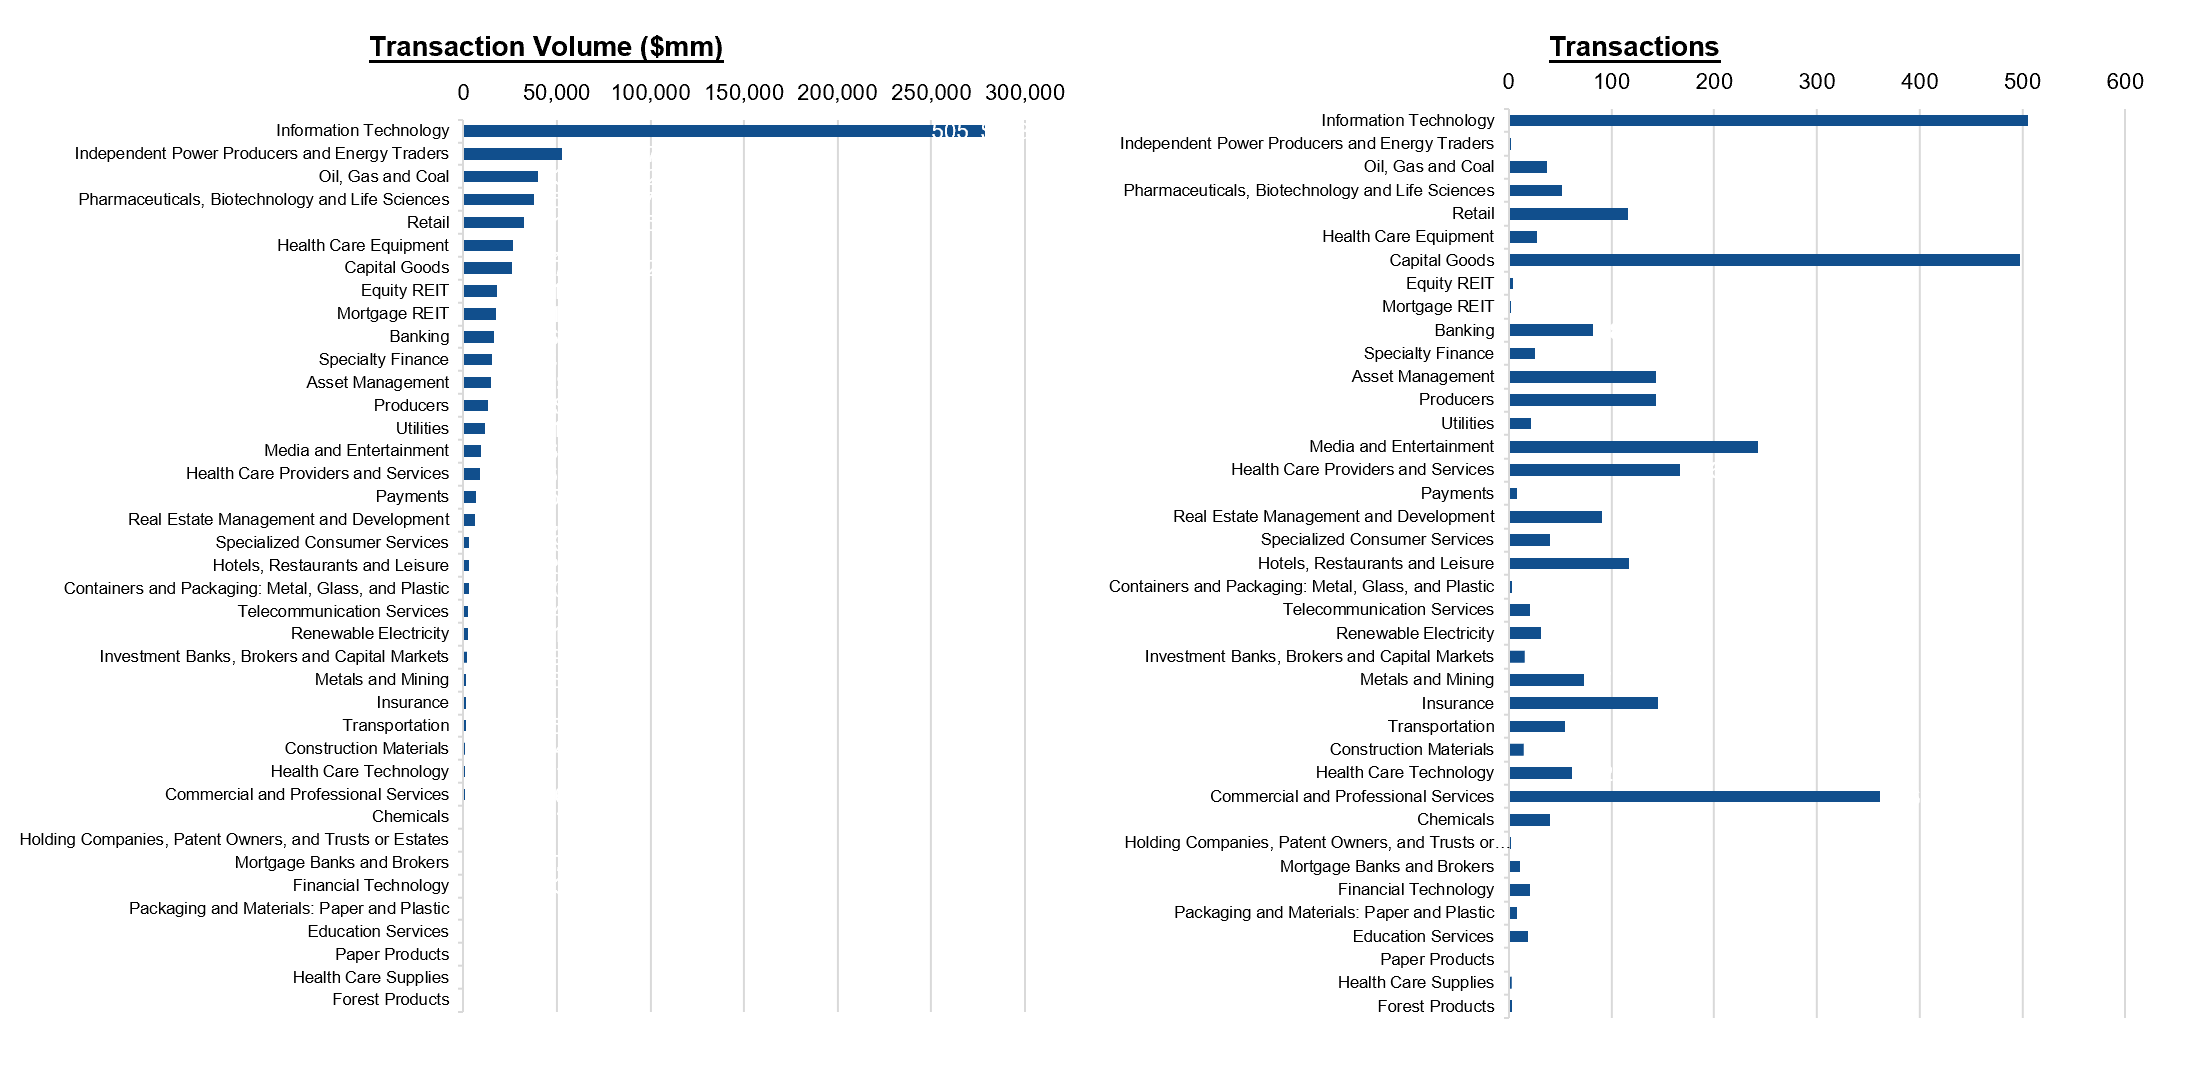
Technology, Media & Telecommunications (TMT) led all sectors with $290.4 billion in disclosed transaction value across 769 transactions, representing approximately 41.7% of total national deal value. Information technology accounted for the largest concentration of activity within the sector, while media, entertainment, and telecommunications contributed additional transaction volume. The sector's substantial value concentration highlighted the importance of technology-related assets in corporate acquisition strategies and capital allocation. Healthcare generated $74.0 billion across 312 transactions, with activity spanning pharmaceuticals, biotechnology, life sciences, medical equipment, and healthcare providers. Together, these industries reflected continued acquisition interest across technology infrastructure, specialized healthcare capabilities, and businesses operating in research-intensive and service-oriented markets.
Energy and Utilities ranked second nationally by disclosed transaction value, generating $106.0 billion across 93 transactions, with particularly significant contributions from independent power producers, energy trading businesses, and traditional oil and gas assets. The sector's relatively limited transaction count compared with its aggregate value reflected a concentration of larger transactions. Financials accounted for $74.6 billion across 456 transactions, supported by activity in banking, asset management, specialty finance, insurance, and related financial services. Consumer businesses contributed $51.4 billion across 435 transactions, while Industrials recorded 913 transactions totaling $28.4 billion, making industrials the most active classified sector by deal count. Real Estate represented $24.3 billion, followed by Materials at $5.8 billion. Transactions categorized as Unclassified accounted for an additional $42.0 billion across 1,313 deals, reflecting a meaningful portion of activity outside the defined sector classifications.
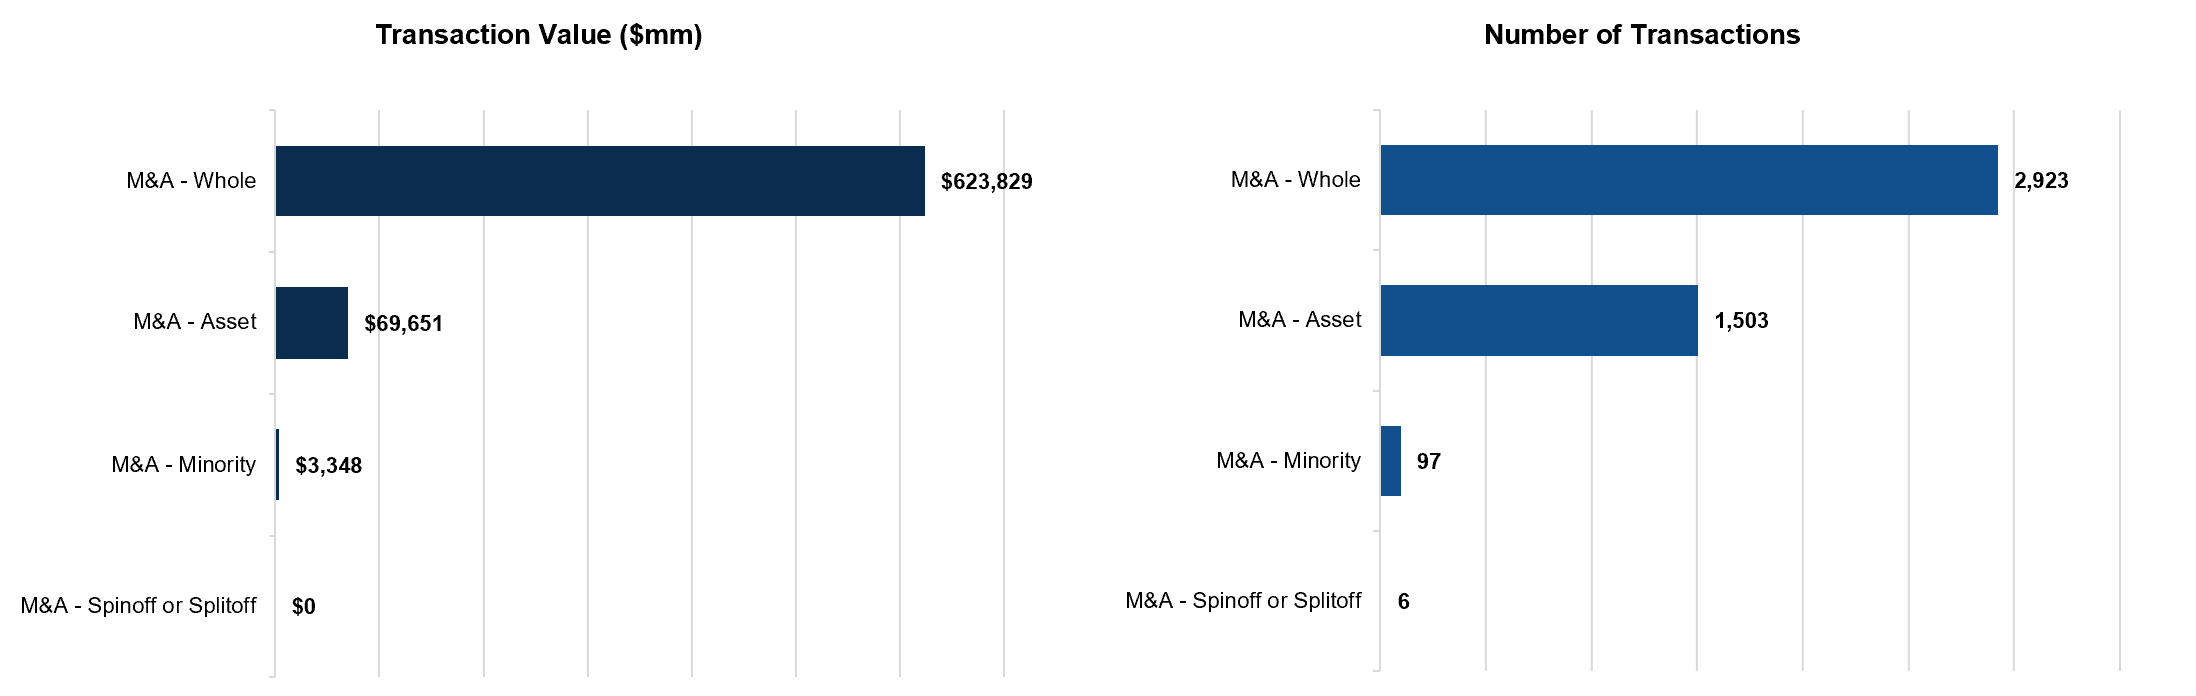
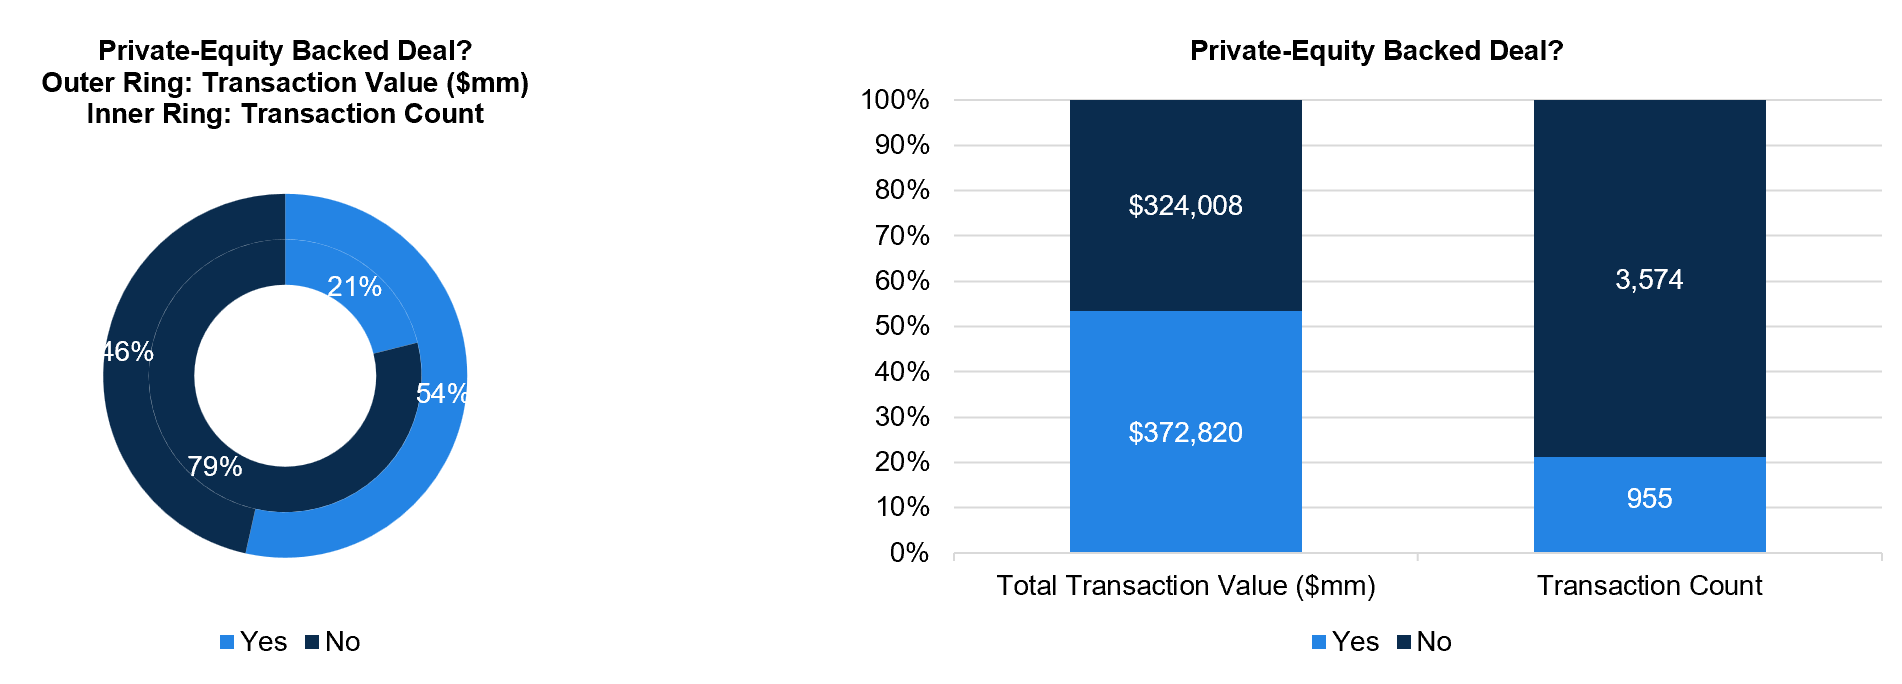
By transaction structure, whole-company acquisitions dominated the market, accounting for 2,923 transactions, or approximately 64.5% of total deal count, and $623.8 billion in disclosed value. Asset acquisitions represented another 1,503 transactions totaling $69.7 billion, indicating substantial activity involving selected operating assets, business divisions, and other asset-level transactions. Minority acquisitions accounted for 97 transactions and $3.3 billion, while six transactions were classified as spinoffs or splitoffs, with no disclosed transaction value reflected in the charts. Private-equity-backed transactions represented approximately 21.1% of total deal count, comprising 955 transactions and $372.8 billion in disclosed value, or 53.5% of the national total. By comparison, non-private-equity-backed transactions accounted for 3,574 deals and $324.0 billion. This disparity between private equity's share of transaction count and aggregate value underscored the substantial dollar-weighted presence of sponsor-backed activity during the quarter.
Regionally, California led the nation's M&A market by both disclosed transaction value and deal count, recording 393 transactions totaling approximately $308.4 billion. The state alone represented approximately 44.3% of national disclosed deal value, illustrating the significant geographic concentration of large transactions. Texas followed with 231 transactions and $64.7 billion, reflecting its substantial contribution to national acquisition activity. New York recorded 229 transactions totaling $51.5 billion, reinforcing its importance within the national transaction landscape, while Florida posted 160 transactions and $7.8 billion. Together, these four states represented approximately 22.4% of national transaction volume and 62.0% of disclosed value, highlighting the distinction between geographic breadth in dealmaking and the concentration of transaction dollars in the country's largest markets.
In aggregate, Q1 2026 demonstrated a national M&A environment characterized by substantial transaction volume, concentrated large-cap deal value, and meaningful private-equity participation. Technology and energy accounted for a disproportionate share of disclosed transaction value, while industrials, financial services, and consumer businesses contributed a broad base of acquisition activity. Whole-company acquisitions remained the predominant transaction structure, emphasizing the role of strategic control and long-term ownership in acquisition strategies. For business owners, strategic acquirers, and financial sponsors evaluating opportunities in 2026, the first quarter highlighted a transaction environment in which sector positioning, transaction structure, and buyer type remained important considerations. Looking ahead, technology infrastructure, energy assets, healthcare services, and specialized industrial businesses represent important areas to monitor as capital allocation priorities and acquisition strategies continue to evolve.
M&A Segmentation
Sector Breakdown:
Sponsor Activity:
M&A Glossary:
M&A – Whole: The acquisition of 100% ownership of a target company, giving the buyer full control.
M&A – Asset: The purchase of specific assets, such as mineral rights or property, without acquiring the entire company.
M&A – Minority: The acquisition of a non-controlling stake, typically under 50%.
M&A – Spinoff or Splitoff: The divestiture of a business unit into a separate entity or distribution of subsidiary shares to shareholders.
Copyright ©2026 William & Wall, S&P Global Market Intelligence
