
Q3 2026 | National M&A Insights
Q3 2026 National M&A Insights from William & Wall examines 3,705 reported U.S. mergers and acquisitions totaling approximately $417.1 billion in disclosed transaction value, highlighting a changing sector mix and a larger share of transaction value attributable to private equity-backed deals. Headquartered in Scottsdale, Arizona, William & Wall provides nationwide investment banking, sell-side M&A advisory, and private equity M&A advisory services to business owners navigating strategic sales, recapitalizations, and ownership transitions.
The information reflects transactions as reported, including deal descriptions, values, and statuses, but may contain gaps, such as undisclosed deal terms or financial metrics, which limit comprehensive analysis. While efforts have been made to ensure accuracy, users should consult primary sources or professional advisors for legal, financial, or strategic decisions. No warranties are made regarding the completeness or reliability of this data, and the provider assumes no liability for its use.
This Quarter - National Transaction Value ($bn) and Transaction Count


National M&A Overview: Q3 2026
The third quarter of 2026 marked a shift in the composition of U.S. mergers and acquisitions, as aggregate disclosed transaction value moderated while private equity-backed deals assumed a larger share of reported consideration. Between July 1 and September 30, the national market recorded 3,705 transactions totaling approximately $417.1 billion, compared with 4,058 transactions and $673.2 billion during the preceding quarter. This represented an 8.7% sequential decline in transaction count and a more pronounced 38.0% reduction in disclosed value. The difference suggests that changes in the size and sector composition of reported transactions contributed more heavily to the quarterly decline than transaction frequency alone. While headline activity moderated, acquisition volume remained distributed across technology, industrials, financial services, healthcare, and consumer businesses, reflecting a substantial number of transactions across the broader U.S. economy.
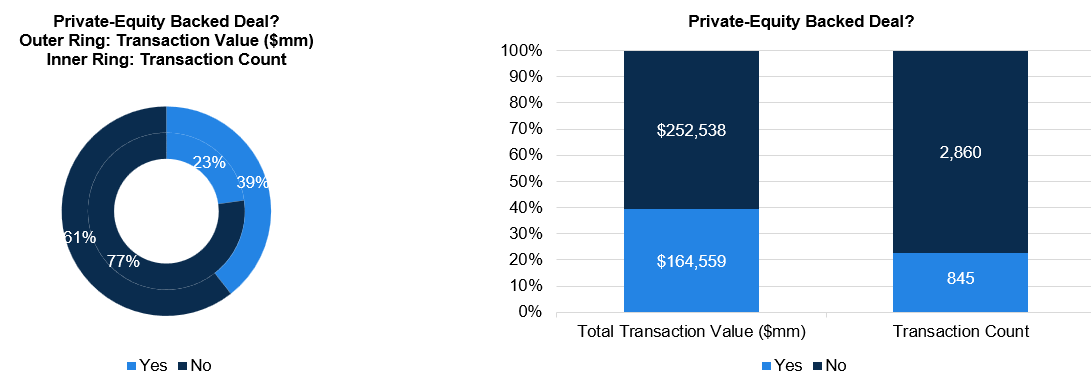
Private equity participation offered a contrasting perspective to the decline in total transaction value. The quarter included 845 transactions classified as private equity-backed, representing approximately 22.8% of reported deal count and $164.6 billion in disclosed value. Notably, PE-backed consideration increased from $119.3 billion in Q2, even as the total number of sponsor-backed transactions declined modestly. As a result, the PE-backed share of aggregate transaction value increased from approximately 17.7% in Q2 to 39.5% in Q3. Transactions not identified as PE-backed accounted for 2,860 deals and $252.5 billion, representing the majority of transaction count but a smaller share of disclosed consideration than in the preceding quarter. Although sponsor backing does not necessarily establish direct sponsor acquisition or capital deployment, the shift illustrates the significance of sponsor-associated transactions within the third quarter's reported M&A activity.
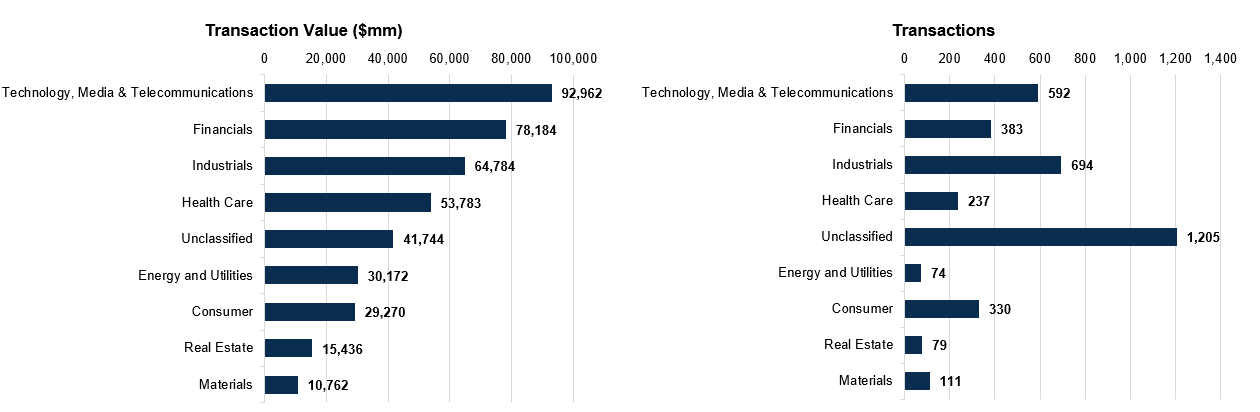
Sector leadership also became more balanced relative to Q2, when Technology, Media & Telecommunications (TMT) and Energy and Utilities accounted for nearly half of national disclosed value. TMT remained the largest sector by transaction value in Q3, generating approximately $93.0 billion across 592 acquisitions, but its contribution was considerably lower than the $169.4 billion recorded in Q2. Financials emerged as the second-largest sector by disclosed consideration, accounting for $78.2 billion across 383 transactions, nearly doubling its prior-quarter value. Industrials followed with $64.8 billion across 694 transactions, maintaining its position as the most active explicitly classified sector by deal count. Together, TMT, Financials, and Industrials represented approximately 56.6% of reported transaction value, reflecting a different distribution of activity from the technology- and energy-led concentration observed earlier in the year.
Monthly results revealed additional differences in the timing of reported acquisitions. July began the quarter with 1,289 transactions totaling $137.1 billion, followed by August with 1,213 transactions and the quarter's highest monthly disclosed value of $161.4 billion. September closed with 1,203 transactions totaling $118.6 billion, marking the lowest monthly transaction count and value of Q3. Financials contributed approximately $38.7 billion in August, while TMT recorded $37.5 billion during the same month. Industrials, meanwhile, generated its largest monthly disclosed value in September at $28.6 billion, despite experiencing a decline in transaction count from 271 in July to 181 in September. These patterns demonstrate that individual sectors followed different trajectories within the same reporting period, with variations in transaction value that were not necessarily proportional to changes in deal frequency.
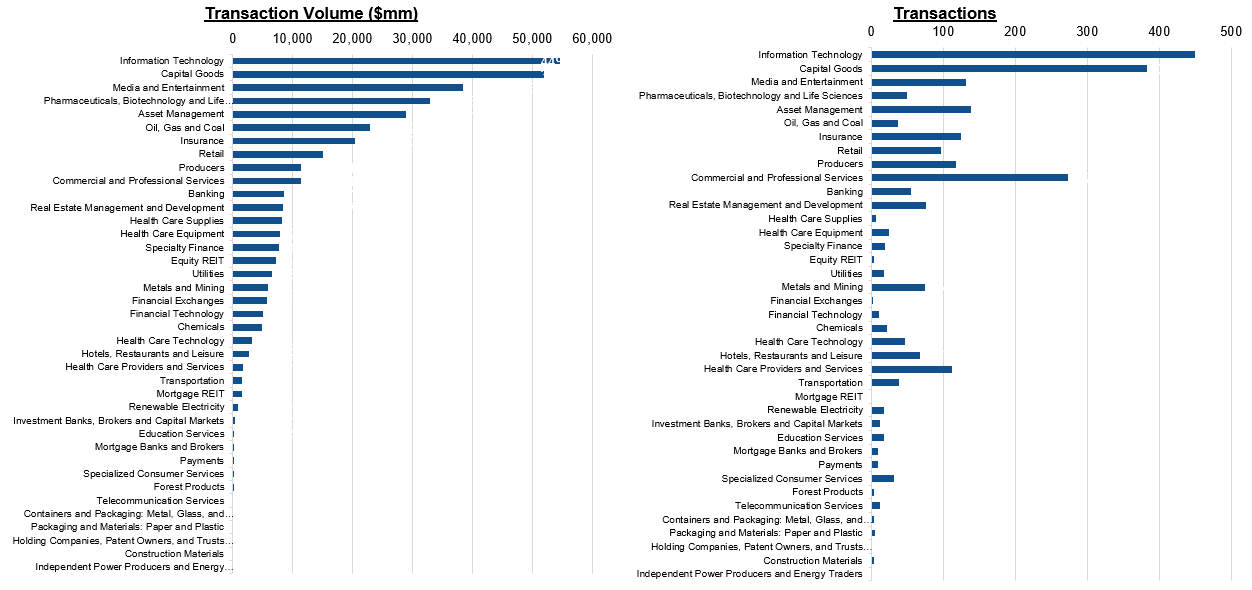
Beyond the leading sectors, Healthcare accounted for $53.8 billion across 237 transactions, with pharmaceuticals, biotechnology, life sciences, healthcare services, and related businesses represented in the underlying industry classifications. Consumer contributed $29.3 billion across 330 transactions, while Energy and Utilities generated $30.2 billion across 74 deals, significantly below its $150.7 billion contribution in Q2. Real Estate recorded 79 transactions and $15.4 billion in disclosed value, while Materials accounted for 111 deals totaling $10.8 billion. Information Technology, Capital Goods, and Commercial and Professional Services were among the most active detailed industry categories by transaction count, demonstrating that acquisition activity extended well beyond sectors responsible for the largest disclosed values. At the same time, 1,205 transactions were classified as Unclassified, representing approximately one-third of national deal count and $41.7 billion in reported value, a meaningful limitation when comparing activity across industries.
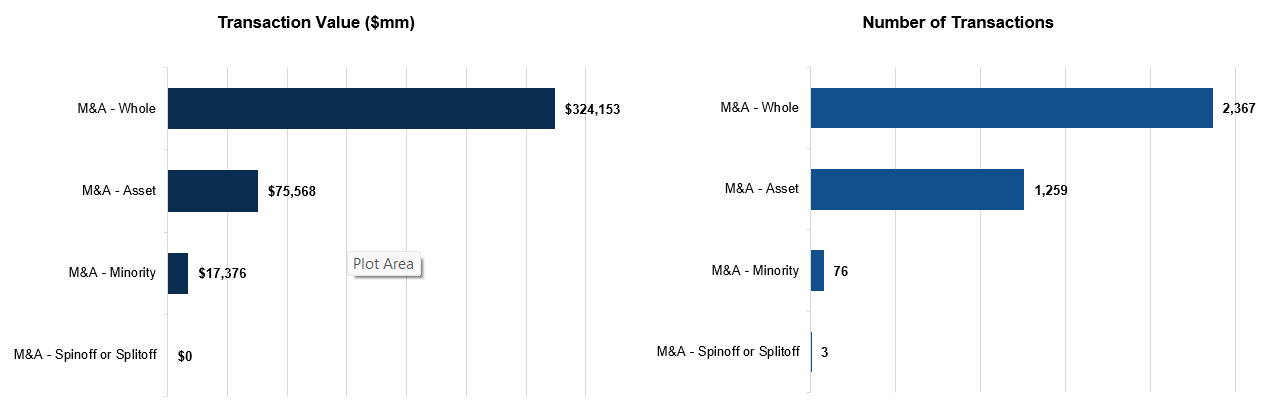
The structure of reported transactions provides further context for the quarter's changing value distribution. Whole-company acquisitions remained the largest category, representing 2,367 transactions and $324.2 billion in disclosed consideration, equivalent to approximately 63.9% of deal count and 77.7% of aggregate value. Asset acquisitions contributed another 1,259 transactions totaling $75.6 billion, while minority investments accounted for 76 deals and $17.4 billion. Three additional transactions were classified as spinoffs or splitoffs, with no disclosed consideration recorded in that category. Relative to Q2, whole-company acquisitions represented a smaller proportion of total disclosed consideration, while asset and minority transactions occupied a greater combined share. The distribution illustrates the range of structures through which businesses and assets changed ownership during the quarter, as full-company acquisitions remained dominant without encompassing the entirety of reported M&A activity.
Viewed collectively, Q3 2026 presented a national M&A market in which aggregate deal value declined but transaction composition became increasingly important to interpreting the broader environment. Private equity-backed transactions represented a substantially larger share of disclosed consideration, Financials and Industrials gained prominence relative to the preceding quarter, and technology remained a leading source of acquisition value despite a meaningful sequential reduction. For business owners considering a sale or strategic recapitalization, these developments underscore the limitations of relying solely on national transaction totals when assessing exit conditions. Buyer interest, financing structures, operating performance, and the strategic characteristics of individual businesses can vary materially across industries and transaction sizes. The third quarter therefore reinforced the importance of company-specific preparation, thoughtful buyer selection, and disciplined transaction execution for owners navigating the U.S. middle-market M&A landscape.
M&A Segmentation
Sector Breakdown:
Sponsor Activity:
M&A Glossary:
M&A – Whole: The acquisition of 100% ownership of a target company, giving the buyer full control.
M&A – Asset: The purchase of specific assets, such as mineral rights or property, without acquiring the entire company.
M&A – Minority: The acquisition of a non-controlling stake, typically under 50%.
M&A – Spinoff or Splitoff: The divestiture of a business unit into a separate entity or distribution of subsidiary shares to shareholders.
Copyright ©2026 William & Wall, S&P Global Market Intelligence
