
Q4 2025 | National M&A Insights
The information reflects transactions as reported, including deal descriptions, values, and statuses, but may contain gaps, such as undisclosed deal terms or financial metrics, which limit comprehensive analysis. While efforts have been made to ensure accuracy, users should consult primary sources or professional advisors for legal, financial, or strategic decisions. No warranties are made regarding the completeness or reliability of this data, and the provider assumes no liability for its use.
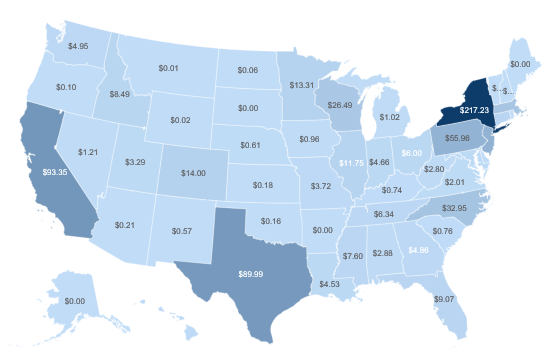
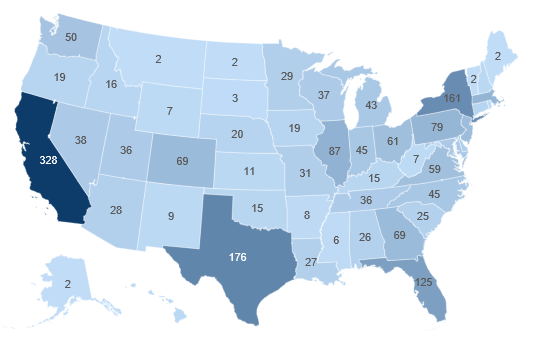
This Quarter - National Transaction Value ($bn) and Transaction Count
National M&A Overview: Q4 2025
The U.S. M&A market in Q4 2025, spanning October 1 to December 31, closed the year with continued momentum, recording approximately 3,712 disclosed transactions and $806 billion in total disclosed value across all major sectors. Deal volume and value both accelerated sequentially as year-end execution urgency, improved credit availability, and increased clarity around monetary policy catalyzed buyer conviction. A widely anticipated 25-basis-point rate cut by the Federal Reserve in November, combined with stabilizing leverage multiples and narrowing bid-ask spreads, supported a constructive close to the year—particularly in large-cap and sponsor-backed transactions.
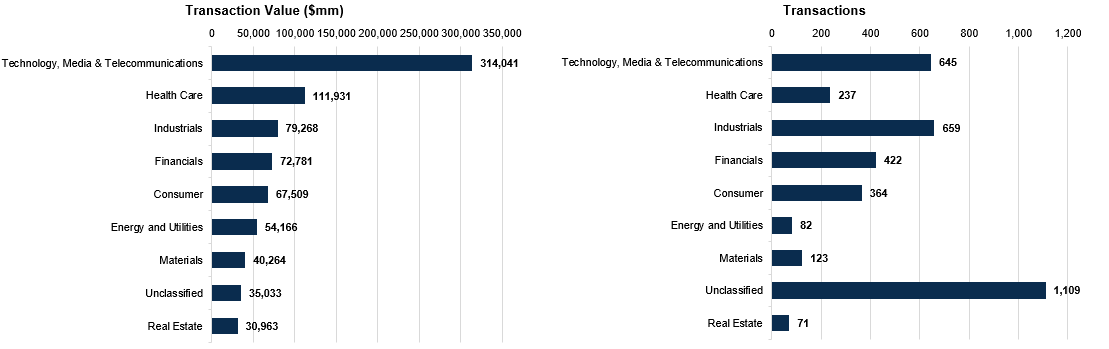
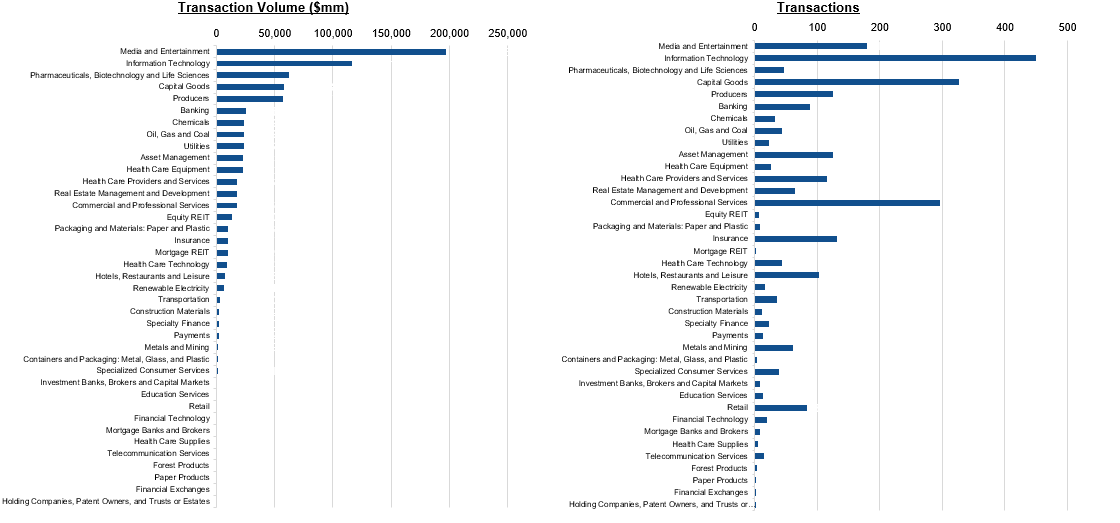
Technology, Media & Telecommunications (TMT) once again led the quarter with $314.0 billion in disclosed value, reflecting sustained consolidation across artificial intelligence, cloud infrastructure, and cybersecurity. Strategic acquirers remained active in platform-defining transactions, while private-equity sponsors continued to aggregate vertical software and data-driven businesses with durable recurring revenue. Healthcare followed closely with $111.9 billion led by life sciences, outsourced pharma services, and provider platform expansion. Reshoring initiatives, labor substitution, and productivity-enhancing acquisitions remained central themes as corporates sought scale advantages entering 2026.
Energy and Utilities generated $54.2 billion in disclosed value, supported by a robust pipeline of renewable generation, grid hardening, and power infrastructure investments. Activity remained balanced between traditional energy consolidation and energy-transition assets, with sponsors favoring long-duration cash-flow profiles. Financials accounted for $72.7 billion, reflecting continued consolidation among regional banks, insurance platforms, asset managers, and fintech-enabled services. Consumer and Real Estate represented $67.5 billion and $30.1 billion respectively, benefiting from selective recovery in discretionary spending and sustained interest in multifamily and logistics assets. Materials, at $40.2 billion, remained steady but selective, while unclassified transactions totaled $30.9 billion.
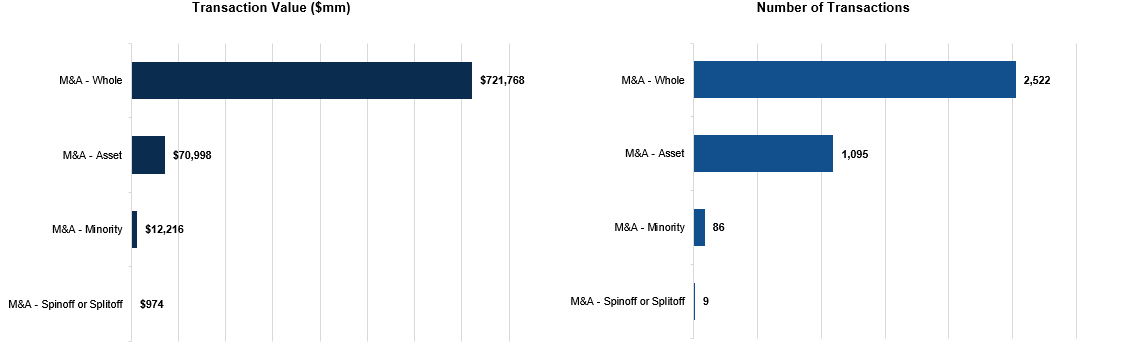
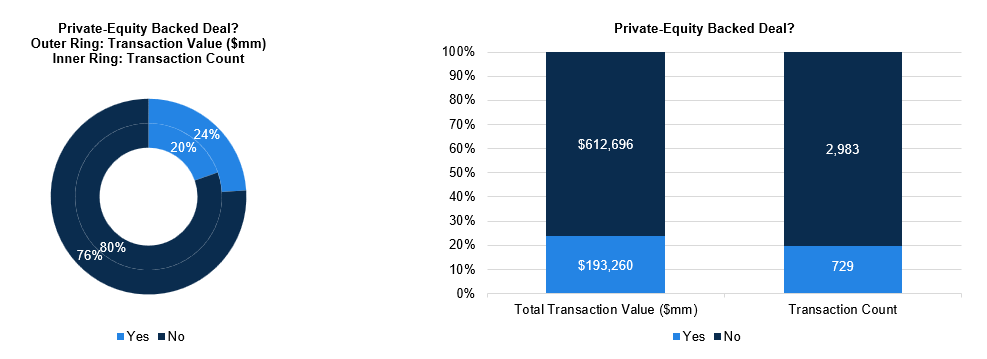
By transaction structure, whole-company acquisitions dominated the market, representing approximately 68% of total deal count and $721 billion in disclosed value, underscoring renewed confidence in long-term ownership and control. Asset acquisitions accounted for roughly $71 billion, while minority investments totaled $12 billion, primarily in growth-stage technology, energy infrastructure, and healthcare innovation. Private-equity sponsors were involved in approximately 20% of all transactions, representing $193 billion in disclosed value, as dry powder deployment accelerated ahead of 2026 fund-cycle pressures. Sponsor activity remained most pronounced in software, industrial services, infrastructure-linked assets, and healthcare services, where visibility, pricing power, and operating leverage justified premium underwriting.
Regionally, California retained its position as the nation’s most active M&A market with 328 transactions, driven by technology, media, and life sciences. Texas followed with 176 transactions , supported by industrials, energy diversification, and logistics platforms. Florida recorded 125 deals, reflecting continued migration of capital, healthcare platforms, and financial services to the Southeast. New York posted 161 transactions, anchored by financial services, media, and professional services activity. Together, these four states represented a majority of national deal value, reinforcing persistent geographic concentration in innovation and growth-oriented regions.
In aggregate, Q4 2025 confirmed a decisive rebound in U.S. dealmaking. Credit markets normalized, leverage structures stabilized, and valuation expectations converged as both buyers and sellers regained confidence in forward earnings visibility. With inflation moderating, monetary policy easing underway, and private-equity capital increasingly under deployment pressure, transaction pipelines enter 2026 with constructive momentum. Sectors tied to artificial intelligence, infrastructure modernization, healthcare services, and energy transition are expected to remain central drivers, as strategic acquirers and financial sponsors alike position for the next expansionary cycle.
M&A Segmentation
Sector Breakdown:
Sponsor Activity:
M&A Glossary:
M&A – Whole: The acquisition of 100% ownership of a target company, giving the buyer full control.
M&A – Asset: The purchase of specific assets, such as mineral rights or property, without acquiring the entire company.
M&A – Minority: The acquisition of a non-controlling stake, typically under 50%.
M&A – Spinoff or Splitoff: The divestiture of a business unit into a separate entity or distribution of subsidiary shares to shareholders.
Copyright ©2026 William & Wall, S&P Global Market Intelligence